Skip to contentتخطَّ إلى المحتوى

Information Designتصميم المعلومات

Research, turned into something people understand.أبحاث تتحوّل إلى ما يفهمه الناس.

Infographics, presentations and data stories built from datasets, technical reports and humanitarian assessments — for readers who need the finding, not the spreadsheet.إنفوجرافيك وعروض وقصص بيانات مبنية من مجموعات البيانات والتقارير التقنية والتقييمات الإنسانية — لقرّاء يحتاجون النتيجة، لا جدول البيانات.

Data visualsرسوم البيانات Presentationالعرض التقديمي Infographicالإنفوجرافيك Research summaryملخص البحث

the gapالفجوة

The insight is in the report. The reader never gets there.الفكرة موجودة في التقرير، لكن القارئ لا يصل إليها.

Datasets, technical reports and assessments hold valuable insight, written in tables and technical language that only specialists can read. The finding that matters is there — on page forty, in the fourth column — and the people who need it most will not find it.تحمل مجموعات البيانات والتقارير التقنية والتقييمات رؤى قيّمة، مكتوبة بجداول ولغة تقنية لا يقرؤها إلا المتخصصون. النتيجة المهمة موجودة — في الصفحة الأربعين، في العمود الرابع — ومن يحتاجها أكثر من غيره لن يجدها.

Accuracy that nobody understands helps nobody.الدقة التي لا يفهمها أحد لا تنفع أحدًا.
A dense table with one figure circled.
A dense table with one figure circled.جدول مزدحم، ورقم واحد فيه محاط بدائرة.

the questionالسؤال

Every chart starts as a question.كل رسم يبدأ بسؤال.

We read the research, verify the data, and look for the insight: what does this audience need to know, and what decision is it meant to support? Only then do we decide what to show — and what to leave in the appendix.نقرأ البحث، ونتحقق من البيانات، ونبحث عن الفكرة: ماذا يحتاج هذا الجمهور أن يعرف، وأي قرار يُفترض أن تدعمه؟ عندها فقط نقرر ما نعرضه — وما نتركه في الملحق.

If a chart cannot say which question it answers, it does not get drawn.الرسم الذي لا يقول أي سؤال يجيب عنه، لا يُرسم.

A page of notes under a magnifying glass.
A page of notes under a magnifying glass.صفحة ملاحظات تحت عدسة مكبّرة.
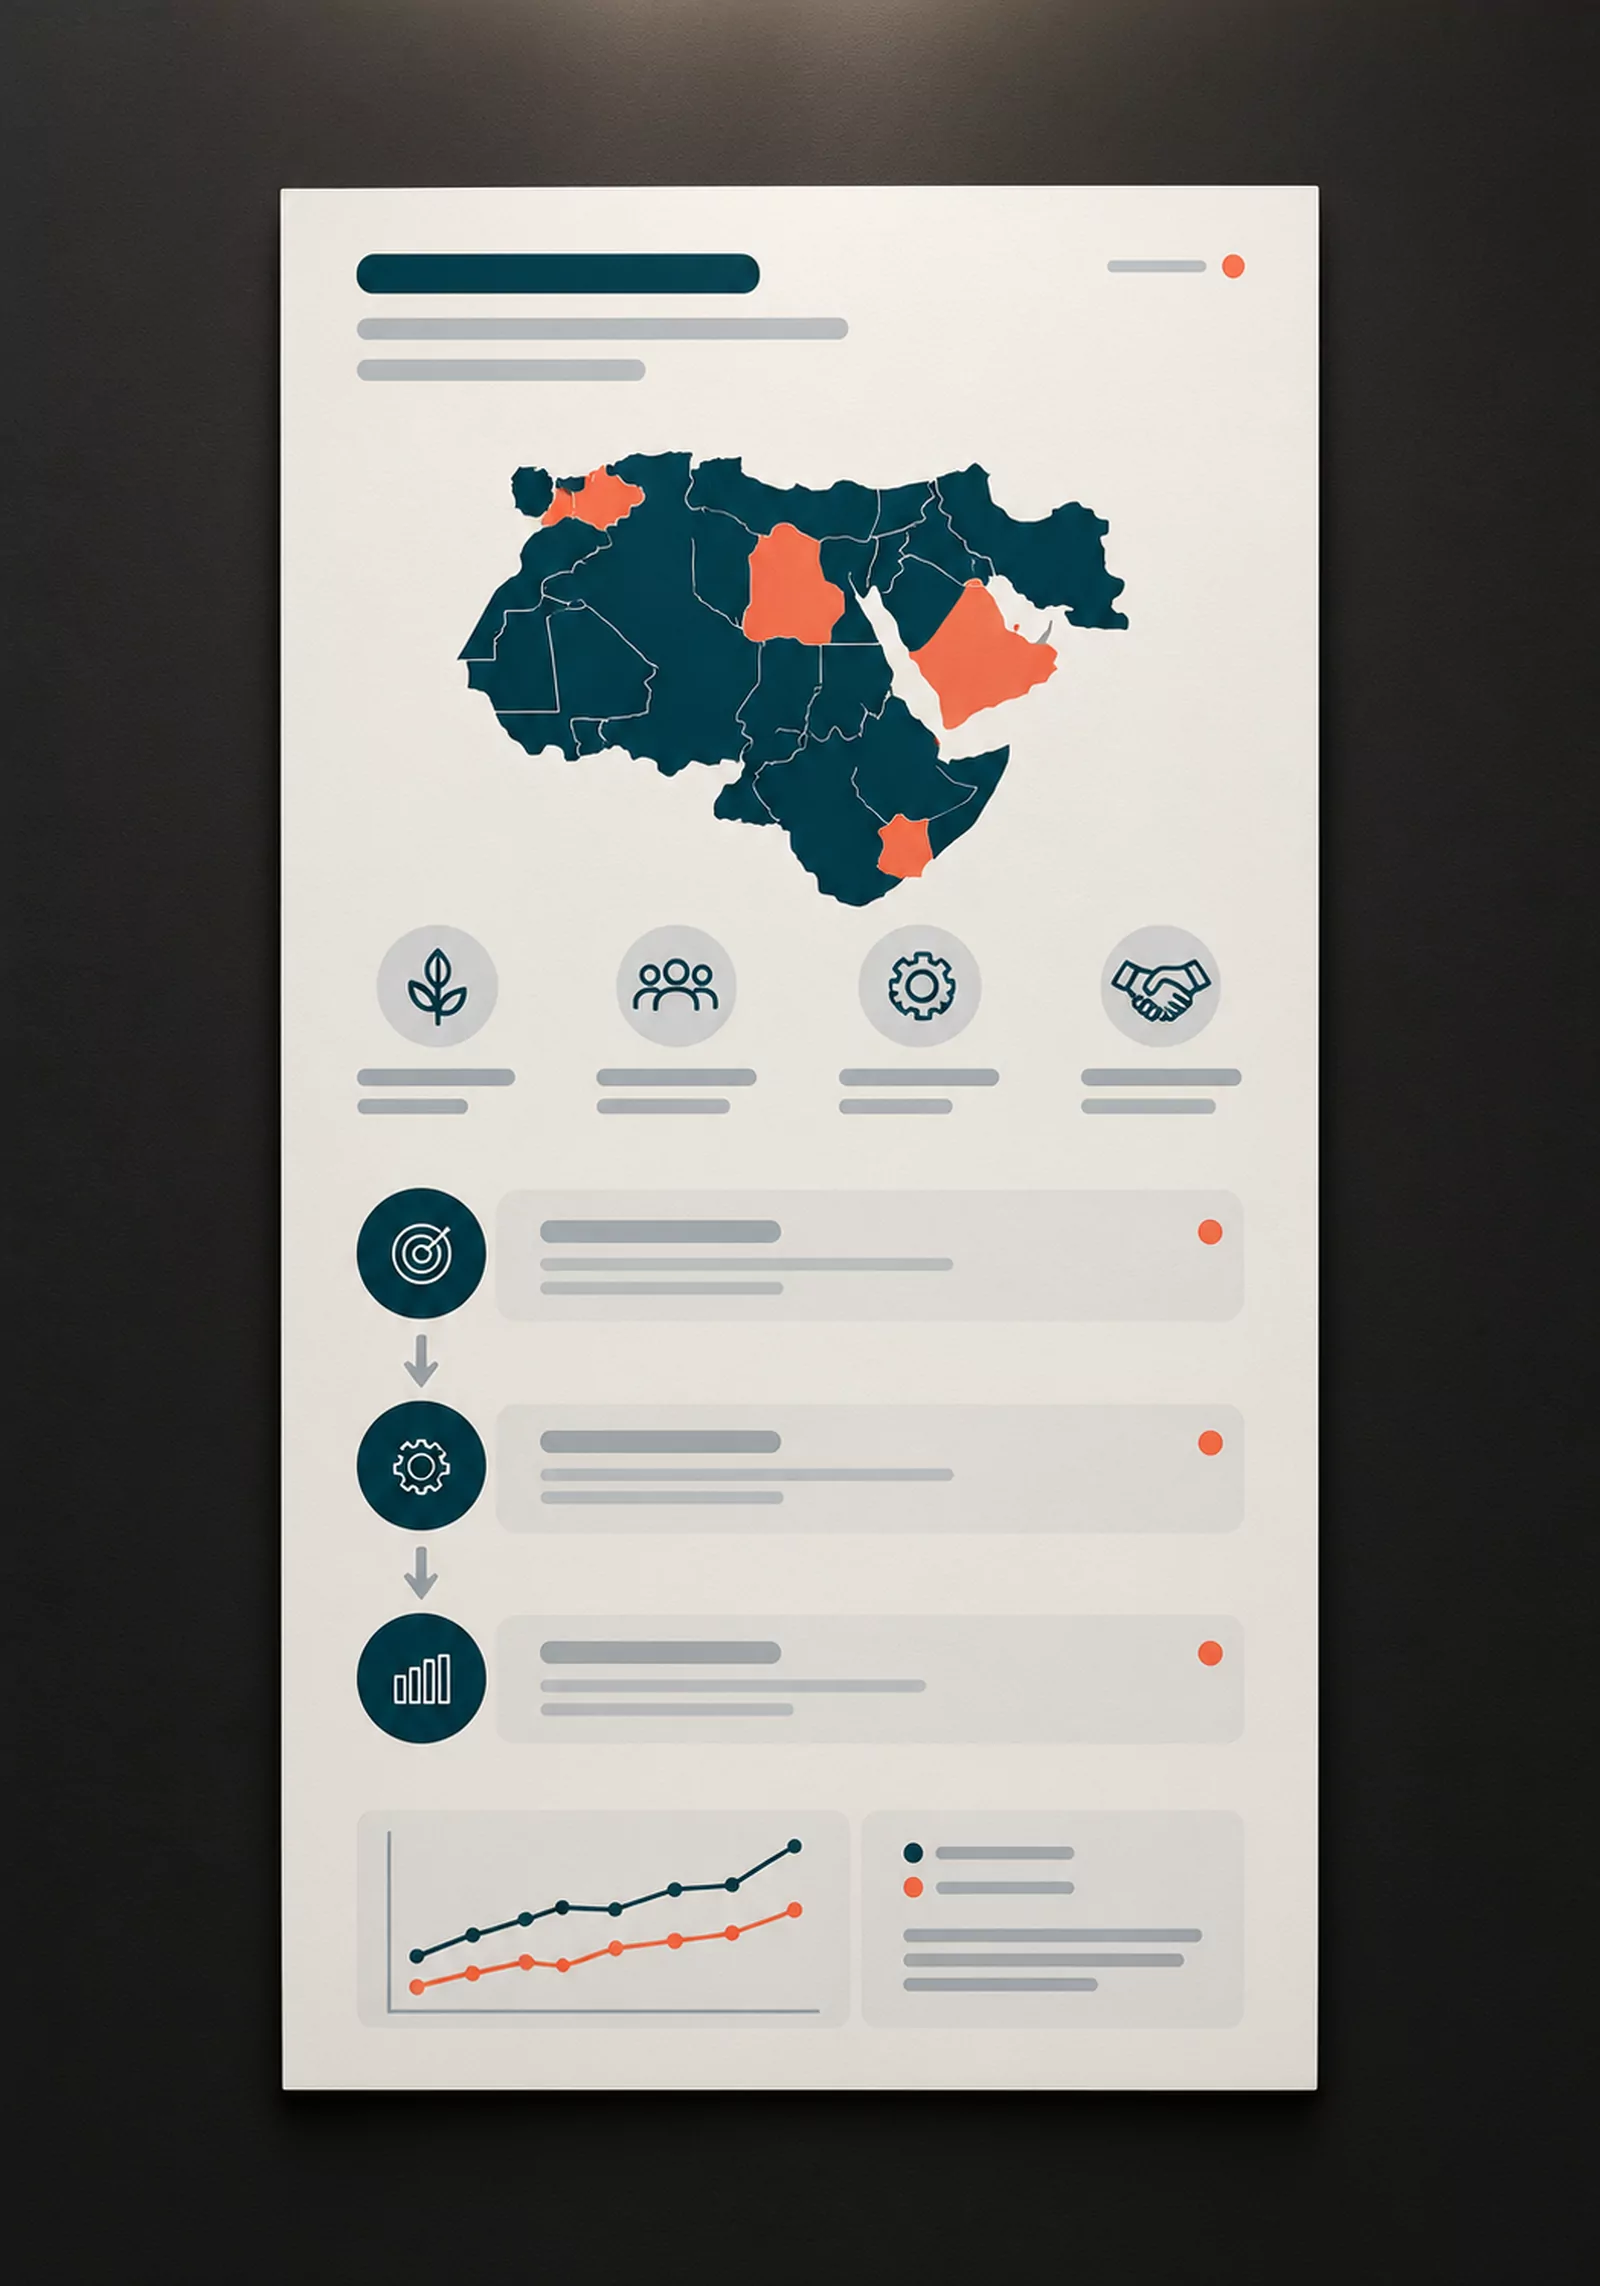
Infographic
Infographicالإنفوجرافيك

the storyالسرد

Data in the order a person thinks.البيانات بالترتيب الذي يفكر به الإنسان.

Context first, then the finding, then what it means, then what follows from it. The visual hierarchy walks the eye along that order, so a reader can follow the argument without being told where to look.السياق أولًا، ثم النتيجة، ثم معناها، ثم ما يترتب عليها. ويقود التسلسل البصري العين على هذا الترتيب، فيتبع القارئ الفكرة دون أن يُقال له أين ينظر.

A story over isolated graphics.القصة قبل الرسوم المنفردة.

A tangled line straightening into a clear path.
A tangled line straightening into a clear path.خط متشابك يستقيم ليصبح مسارًا واضحًا.
Data visuals
Data visualsرسوم البيانات

the formالشكل

Clarity over decoration. Accuracy over complexity.الوضوح قبل الزخرفة، والدقة قبل التعقيد.

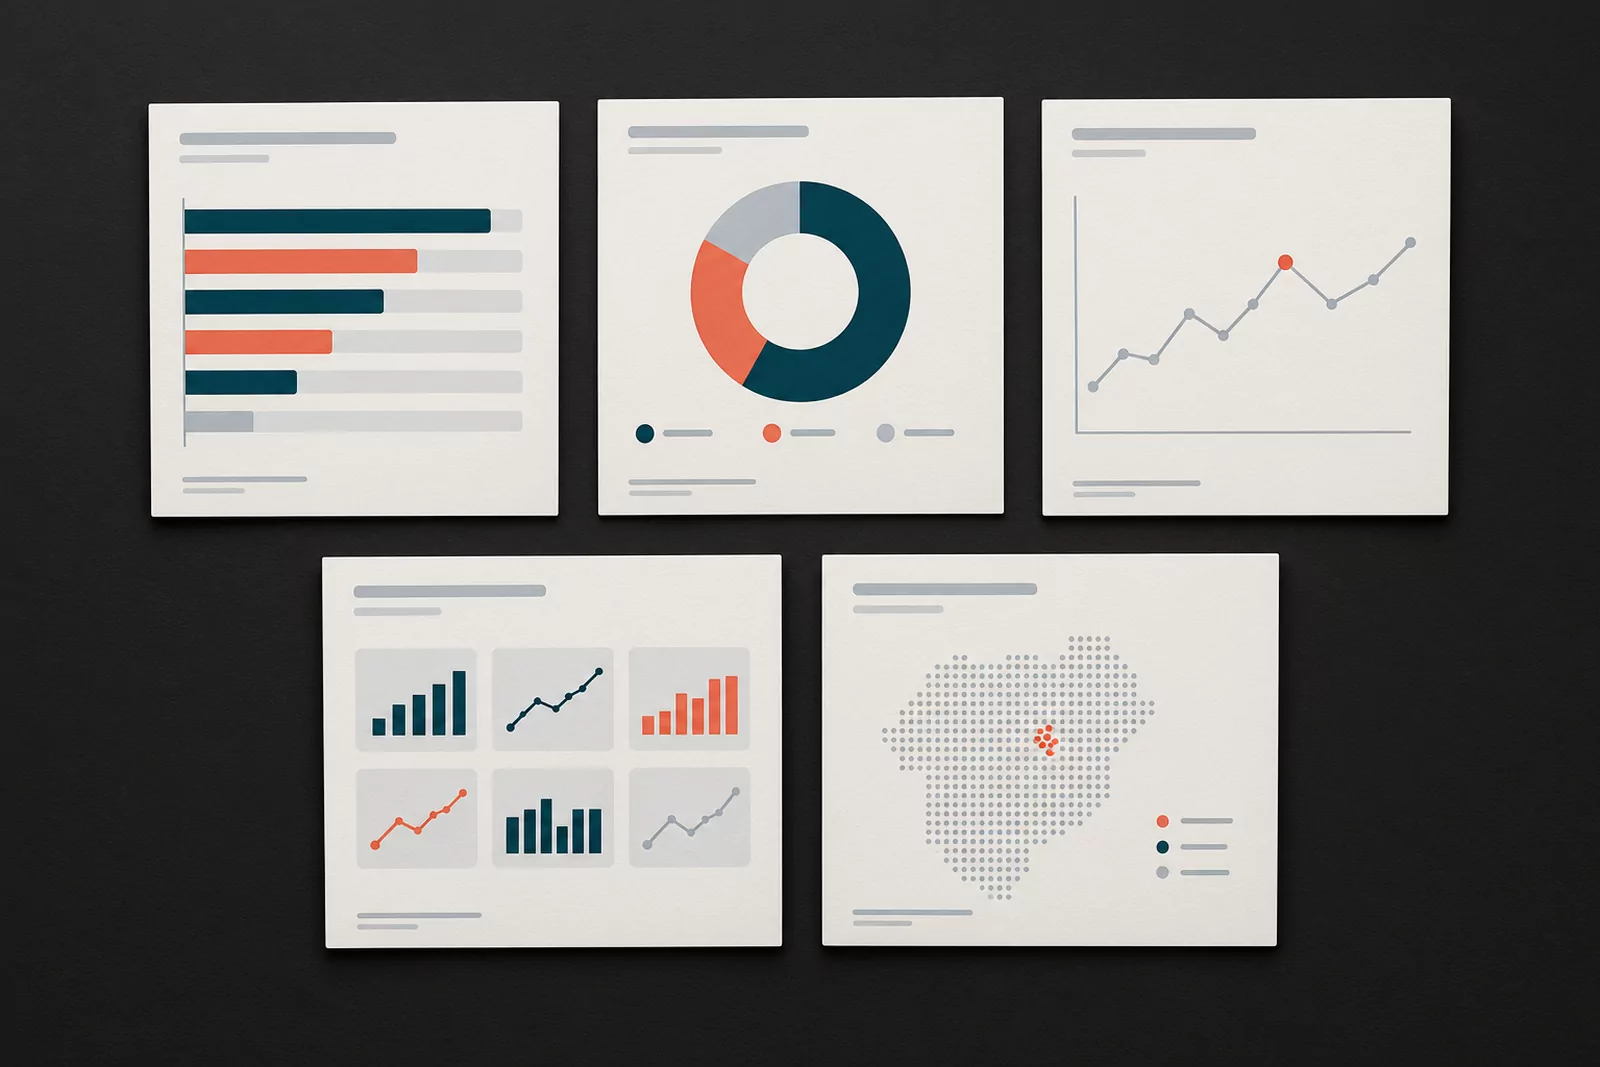
We choose the simplest chart that tells the truth, give colour a meaning and keep it, and fit each visual into the report or presentation it belongs to — built on the same editorial principles as the pages around it.نختار أبسط رسم يقول الحقيقة، ونعطي اللون معنى ونحافظ عليه، ونضع كل عنصر بصري في التقرير أو العرض الذي ينتمي إليه — مبنيًا على الأسس التحريرية نفسها التي بُنيت عليها الصفحات من حوله.

Colour is used to mean something, never to fill space.يُستخدم اللون ليعني شيئًا، لا ليملأ فراغًا.

A simple bar chart with one bar and one point marked.
A simple bar chart with one bar and one point marked.رسم أعمدة بسيط، عُلِّم فيه عمود واحد ونقطة واحدة.
Presentation
Presentationالعرض التقديمي

what it producedما أنتجه

Made to be read in one sitting.مصمَّمة لتُقرأ في جلسة واحدة.

Visual communication that decision-makers, partners and the public can take in quickly without losing accuracy: summaries, infographics and presentations built from the same verified evidence.تواصل بصري يستوعبه صنّاع القرار والشركاء والجمهور بسرعة دون أن تضيع الدقة: ملخصات وإنفوجرافيك وعروض مبنية من الأدلة الموثّقة نفسها.

We do not publish results we cannot prove. These chapters stop at what was delivered.لا ننشر نتائج لا نستطيع إثباتها. تقف هذه الفصول عند ما سُلِّم.

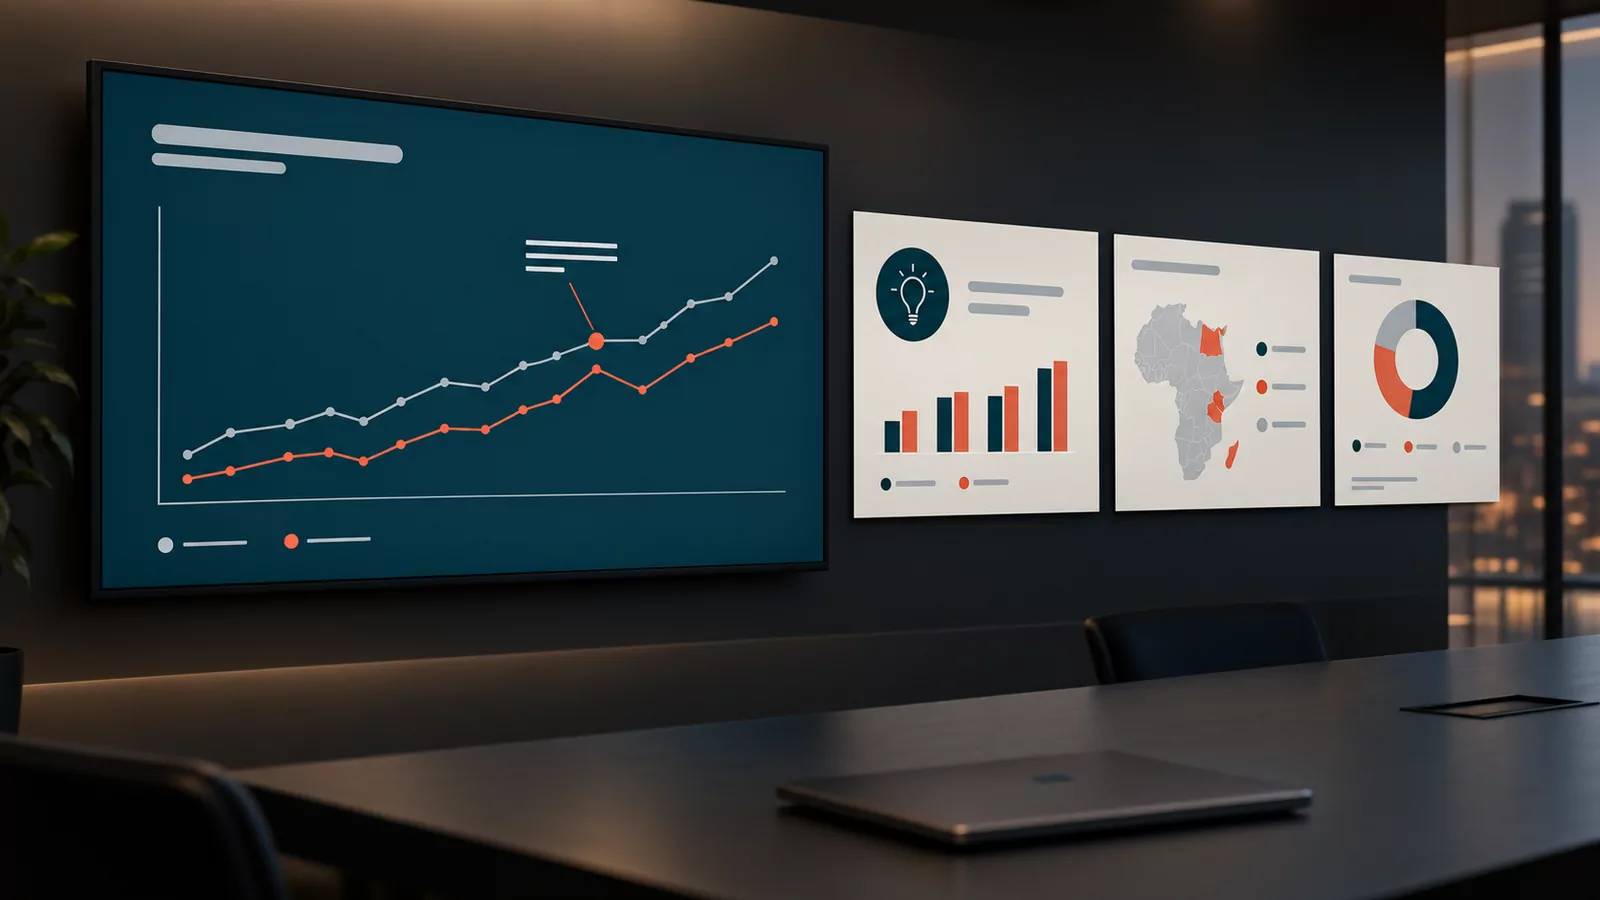
Four surfaces arranged around one centre.
Four surfaces arranged around one centre.أربع واجهات مرتّبة حول مركز واحد.
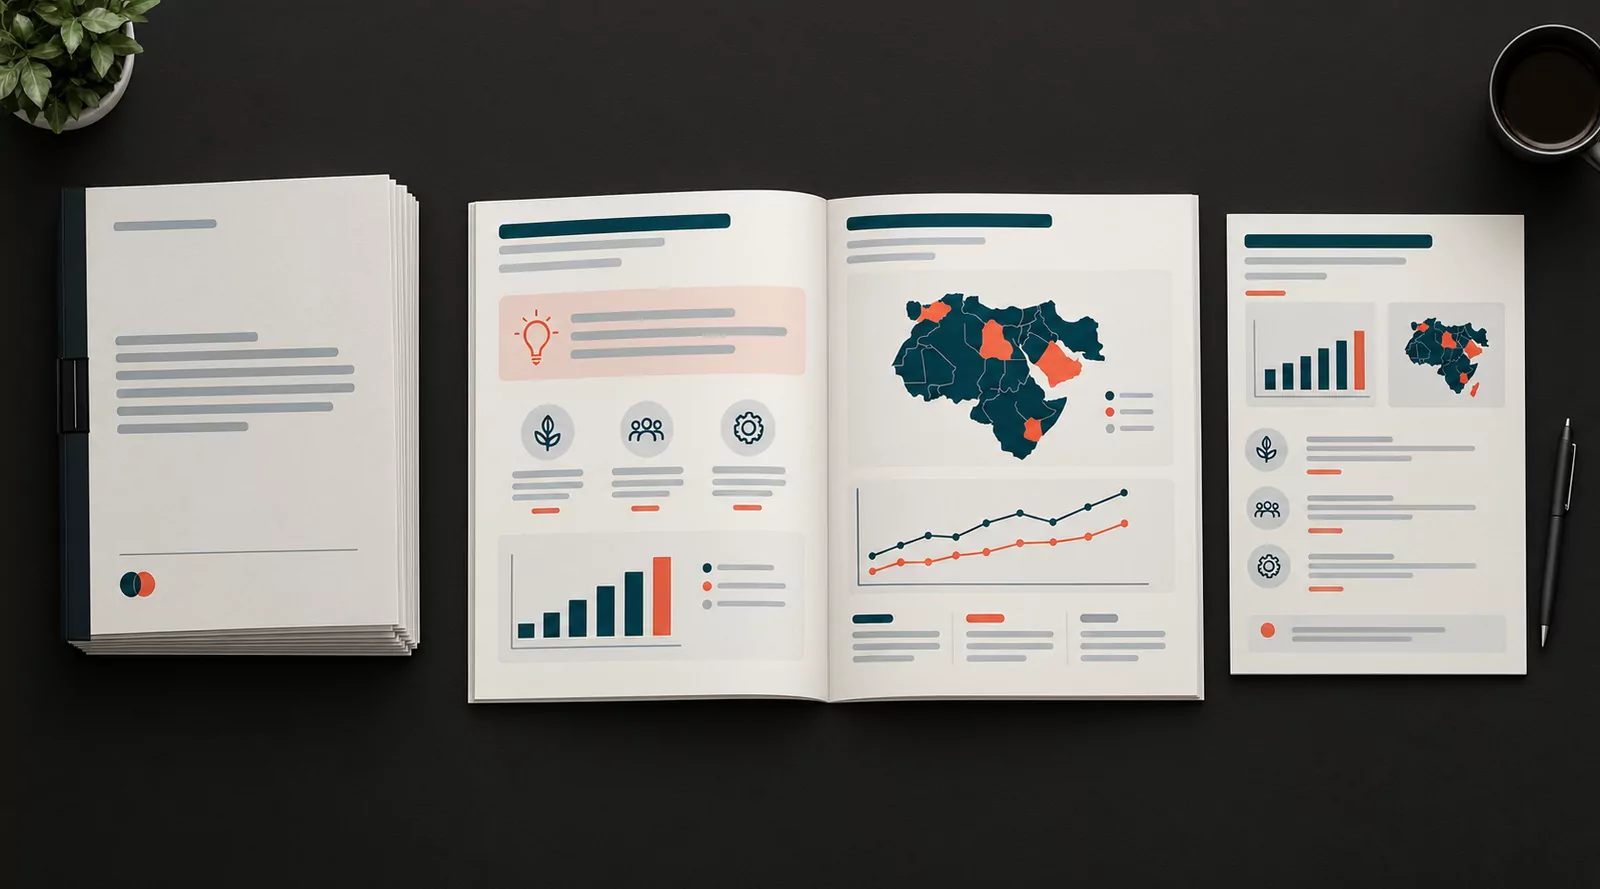
Research summary
Research summaryملخص البحث

More case studiesدراسات حالة أخرى

Keep reading.تابع القراءة.

All case studiesكل دراسات الحالة

Your project could be the next one here.مشروعك قد يكون التالي هنا.

Tell the Pixora team what you are building; we’ll get back to you as soon as possible.أخبر فريق بيكسورا بما تبنيه، وسنتواصل معك في أقرب فرصة ممكنة.

Who you are talking to

Muhalab Basheirمهلب بشير

Visual Communications Designerمصمم المحتوى البصري

Working remotely with clients across the Gulf and Egypt.نعمل عن بُعد مع عملاء في الخليج ومصر.

We’ll get back to you as soon as possible

Sunday to Thursday